TL;DR
Sourcing data directly from disk IS faster than caching in memory. I brought receipts. Because hardware got wider but not faster, the old methods don't get you there. You need new tools to use what is scaling and avoid what isn't.
Introduction
In part 1 I showed how some computer performance factors are scaling exponentially while others have been stagnant for decades. I then asserted, without proof, that sourcing data from disk can be faster than from memory. What follows is the proof.
Computer Science dogma says that unused memory should be used to cache things from the filesystem because the disk is slow and memory is fast. Given that disk bandwidth is growing exponentially and memory access latency has stagnated this isn't always true anymore.
Experimental set up
We need data and something straight forward to do with the data. I used my free will or the illusion thereof to create a benchmark I cleverly call "counting 10s". I write some pseudo random integers between 0 and 20 to a buffer and then count how many of the integers are 10. I want to make sure we are doing all the counting in a single thread to simulate an Amdahl's Law situation.
So how fast can we expect this to run? The upper limit would be the memory bandwidth.
My testing rig is a server with an old AMD EPYC 7551P 32-Core Processor on a Supermicro H11SSL-i and 96GB of DDR4 2133 MHz and a couple of 1.92TB Samsung PM983a PCIe 3.0 SSDs I pieced together from EBay parts. Given the way this server is configured, the upper limit for memory bandwidth can be calculated as 3 channels * 2133MT/s * 8B/T / 4 numa domains = ~13GB/s for a single thread. It's kind of an odd system but that just makes it more fun to optimize for!
The disks are rated at 3.1GB/s read BW each for an upper limit of 6.2GB/s. I made a raid0 volume with 4KB stripe size, formatted the the raid as ext4 with no journaling, and made sure it fully finished initializing the metadata before running the tests.
sudo mdadm --create /dev/md0 --level=0 --raid-devices=2 --chunk=4K /dev/nvme1n1 /dev/nvme2n1
sudo mkfs.ext4 -F -L data -O ^has_journal -E lazy_itable_init=0 /dev/md0
sudo mount -o noatime /dev/md0 mnt
We'll use a 50GB dataset for most benchmarking here, because when I started this I thought the test system only had 64GB and it stuck.
Simple Loop
The simple and cleanest way to do this in C would look like this.
#include <stdio.h>
#include <stdlib.h>
#include <fcntl.h>
#include <sys/mman.h>

// count_10_loop
int main(int argc, char *argv[]) {
    char* filename = argv[1];
    size_t size_bytes = strtoull(argv[2], NULL, 10);
    size_t total_ints = size_bytes / sizeof(int);
    size_t count = 0;

    int fd = open(filename, O_RDONLY);
    int* data = (int*)mmap(NULL, size_bytes, PROT_READ, MAP_SHARED, fd, 0);

    for (size_t i = 0; i < total_ints; ++i) {
        if (data[i] == 10) count++;
    }

    printf("Found %ld 10s\n", count);
}
Just mmap() the file which will give us a buffer that we can read from. Then we just loop and count the 10s.
Because the point is to benchmark we will integrate some timing mechanisms before we move on.
#include <stdio.h>
#include <stdlib.h>
#include <fcntl.h>
#include <sys/mman.h>
#include <sys/time.h>

long get_time_us() {
    struct timeval tv;
    gettimeofday(&tv, NULL);
    return tv.tv_sec * 1000000L + tv.tv_usec;
}

// count_10_loop
int main(int argc, char *argv[]) {
    char* filename = argv[1];
    size_t size_bytes = strtoull(argv[2], NULL, 10);
    size_t total_ints = size_bytes / sizeof(int);
    size_t count = 0;

    int fd = open(filename, O_RDONLY);
    int* data = (int*)mmap(NULL, size_bytes, PROT_READ, MAP_SHARED, fd, 0);

    long start = get_time_us();
    for (size_t i = 0; i < total_ints; ++i) {
        if (data[i] == 10) count++;
    }
    long elapsed = get_time_us() - start;

    printf("simple loop found %ld 10s processed at %0.2f GB/s\n", count, (double)(size_bytes/1073741824)/((double)elapsed/1.0e6));
}
For the first run we're going to be reading from the disk. The disk/filesystem read is going to limit the performance before the memory bandwidth can.
❯ sudo  ./count_10_loop ./mnt/datafile.bin 53687091200
simple loop found 167802249 10s processed at 0.61 GB/s
As expected, it's not anywhere near memory speeds because as everyone knows, disk is slow. We can look at the system and confirm that the first run cached the data to memory.
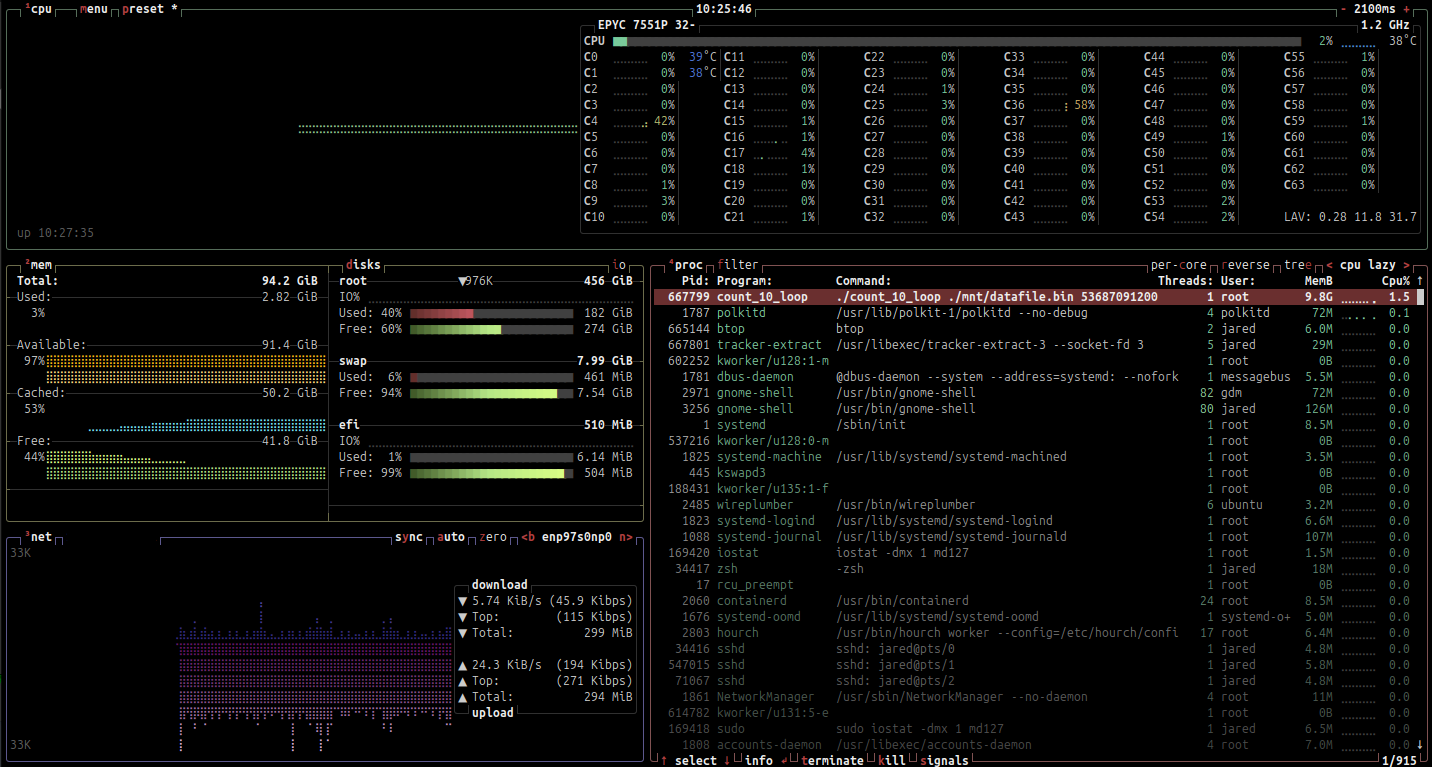
Our expectation is that the second run will be faster because the data is already in memory and as everyone knows, memory is fast.
❯ sudo  ./count_10_loop ./mnt/datafile.bin 53687091200
simple loop found 167802249 10s processed at 3.71 GB/s
It is faster, but clearly that’s slower than the memory can feed it to the processor. What bottleneck might we be hitting? This speed does look possibly correlated to the instructions per second limit for this generation of CPU (between 2GHz * 1.5 IPC = 3G and 3GHz boost * 1.5 IPC = 4.5G instructions per second).
We can use perf to see if the CPU is using vector instructions, if not then the actual compute is the bottleneck.
Percent│      test     %rbp,%rbp
       │    ↓ je       84
       │      lea      (%rbx,%rbp,4),%rcx
       │      mov      %rbx,%rax
       │      xor      %ebp,%ebp
       │      nop
       │70:   xor      %edx,%edx
  1.31 │      cmpl     $0xa,(%rax)
 42.38 │      sete     %dl
 45.72 │      add      $0x4,%rax
  0.01 │      add      %rdx,%rbp
 10.42 │      cmp      %rax,%rcx
  0.16 │    ↑ jne      70
       │84:   xor      %eax,%eax
       │      shr      $0x14,%r12
       │    → call     get_time_us
       │      pxor     %xmm0,%xmm0
       │      pxor     %xmm1,%xmm1
Confirmed. We're running non-vectorized instructions, with a single thread counting that's as fast as it can go with a 2GHz CPU. Well crap. We’ve hit our first non-exponential limit. Even a brand new CPU running this machine code would probably struggle to do much better than a 50% improvement, still well below the memory bandwidth limit.
Unrolling the loop
Good news is this code can definitely be vectorized if we help the compiler. Unroll the loop!
We're gonna make it very obvious to the compiler that it's safe to use vector instructions which could process our integers up to 8x faster.
#include <stdio.h>
#include <stdlib.h>
#include <fcntl.h>
#include <sys/mman.h>
#include <stdint.h>
#include <sys/time.h>

long get_time_us() {
    struct timeval tv;
    gettimeofday(&tv, NULL);
    return tv.tv_sec * 1000000L + tv.tv_usec;
}

// count_10_unrolled
int main(int argc, char *argv[]) {
    char* filename = argv[1];
    size_t size_bytes = strtoull(argv[2], NULL, 10);
    size_t total_ints = size_bytes / sizeof(int);
    size_t count = 0;

    int fd = open(filename, O_RDONLY);
    void* buffer = mmap(NULL, size_bytes, PROT_READ, MAP_SHARED, fd, 0);

    // Get the compiler to align the buffer
    const int * __restrict data = (const int * __restrict)__builtin_assume_aligned(buffer, 4096);
    uint64_t c0=0, c1=0, c2=0, c3=0,
            c4=0, c5=0, c6=0, c7=0,
            c8=0, c9=0, c10=0, c11=0,
            c12=0, c13=0, c14=0, c15=0;

    long start = get_time_us();
    // Unrolling the compiler knows it can use a vector unit like AVX2 to process
    for (size_t i = 0; i < total_ints; i += 16) {
        // removed 'if' to get it to be branchless: each compares to 10, adds 0 or 1
        c0  += (unsigned)(data[i+ 0] == 10);
        c1  += (unsigned)(data[i+ 1] == 10);
        c2  += (unsigned)(data[i+ 2] == 10);
        c3  += (unsigned)(data[i+ 3] == 10);
        c4  += (unsigned)(data[i+ 4] == 10);
        c5  += (unsigned)(data[i+ 5] == 10);
        c6  += (unsigned)(data[i+ 6] == 10);
        c7  += (unsigned)(data[i+ 7] == 10);
        c8  += (unsigned)(data[i+ 8] == 10);
        c9  += (unsigned)(data[i+ 9] == 10);
        c10 += (unsigned)(data[i+10] == 10);
        c11 += (unsigned)(data[i+11] == 10);
        c12 += (unsigned)(data[i+12] == 10);
        c13 += (unsigned)(data[i+13] == 10);
        c14 += (unsigned)(data[i+14] == 10);
        c15 += (unsigned)(data[i+15] == 10);
    }

    // pairwise reduce to help some compilers schedule better
    uint64_t s0 = c0 + c1,   s1 = c2 + c3,   s2 = c4 + c5,   s3 = c6 + c7;
    uint64_t s4 = c8 + c9,   s5 = c10 + c11, s6 = c12 + c13, s7 = c14 + c15;
    uint64_t t0 = s0 + s1,   t1 = s2 + s3,   t2 = s4 + s5,   t3 = s6 + s7;

    count = (t0 + t1) + (t2 + t3);
    long elapsed = get_time_us() - start;

    printf("unrolled loop found %ld 10s processed at %0.2f GB/s\n", count, (double)(size_bytes/1073741824)/((double)elapsed/1.0e6));
}
Check if we now have vectorized instructions with perf.
Percent│       movq      %xmm0,%rcx
       │       movdqa    %xmm7,%xmm14
       │       pxor      %xmm0,%xmm0
       │       nop
       │ e8:   movdqa    %xmm6,%xmm4
  0.30 │       movdqa    %xmm6,%xmm3
  0.12 │       movdqa    %xmm6,%xmm2
  0.35 │       add       $0x1,%rdx
  1.54 │       pcmpeqd   (%rax),%xmm4
 54.64 │       pcmpeqd   0x10(%rax),%xmm3
  1.62 │       movdqa    %xmm6,%xmm1
  0.99 │       add       $0x40,%rax
  0.12 │       pcmpeqd   -0x20(%rax),%xmm2
  3.03 │       pcmpeqd   -0x10(%rax),%xmm1
  1.32 │       pand      %xmm5,%xmm4
  1.25 │       pand      %xmm5,%xmm3
  1.55 │       movdqa    %xmm4,%xmm15
  0.24 │       punpckhdq %xmm0,%xmm4
Confirmed. We're using 128bit vector instructions, this should be up to 4x faster than the original.
NOTE: These are 128-bit vector instructions, but I expected 256-bit. I dug deeper here and found claims that Gen1 EPYC had unoptimized 256-bit instructions. I forced the compiler to use 256-bit instructions and found it was actually slower. Looks like the compiler was smart enough to know that here.
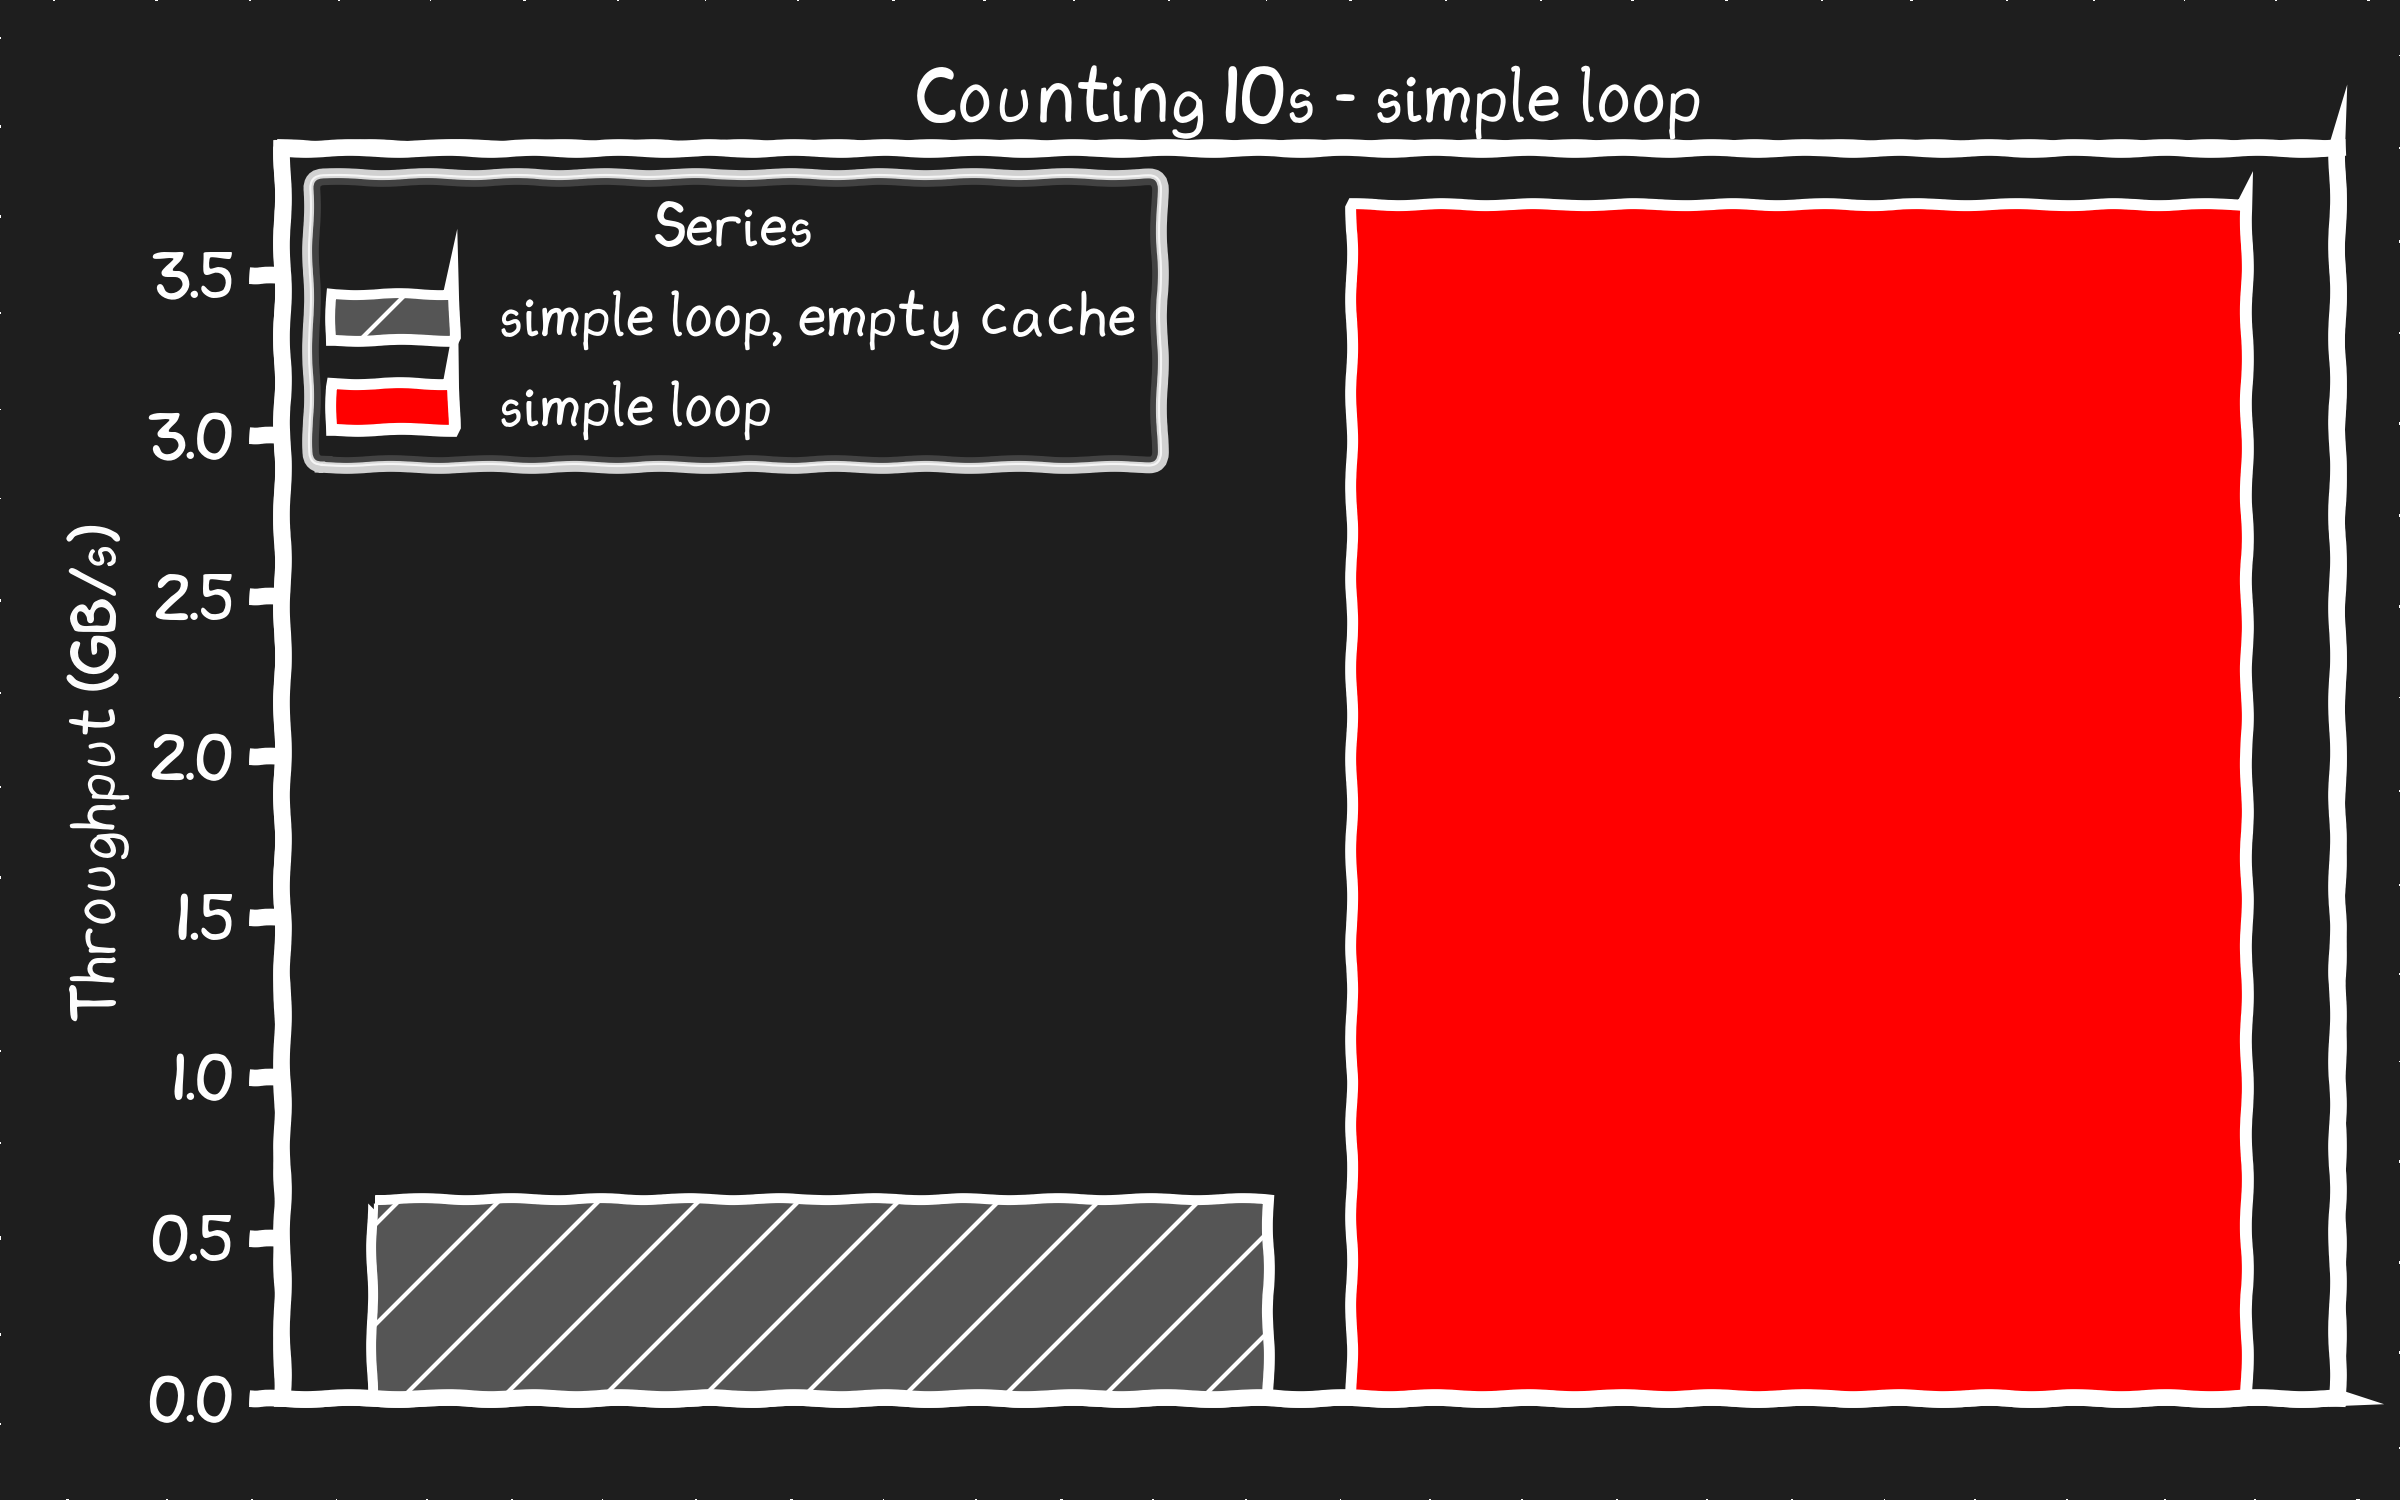
Let's benchmark this unrolled version with the data as page cache in memory.
❯ sudo  ./count_10_unrolled ./mnt/datafile.bin 53687091200
unrolled loop found 167802249 10s processed at 5.51 GB/s
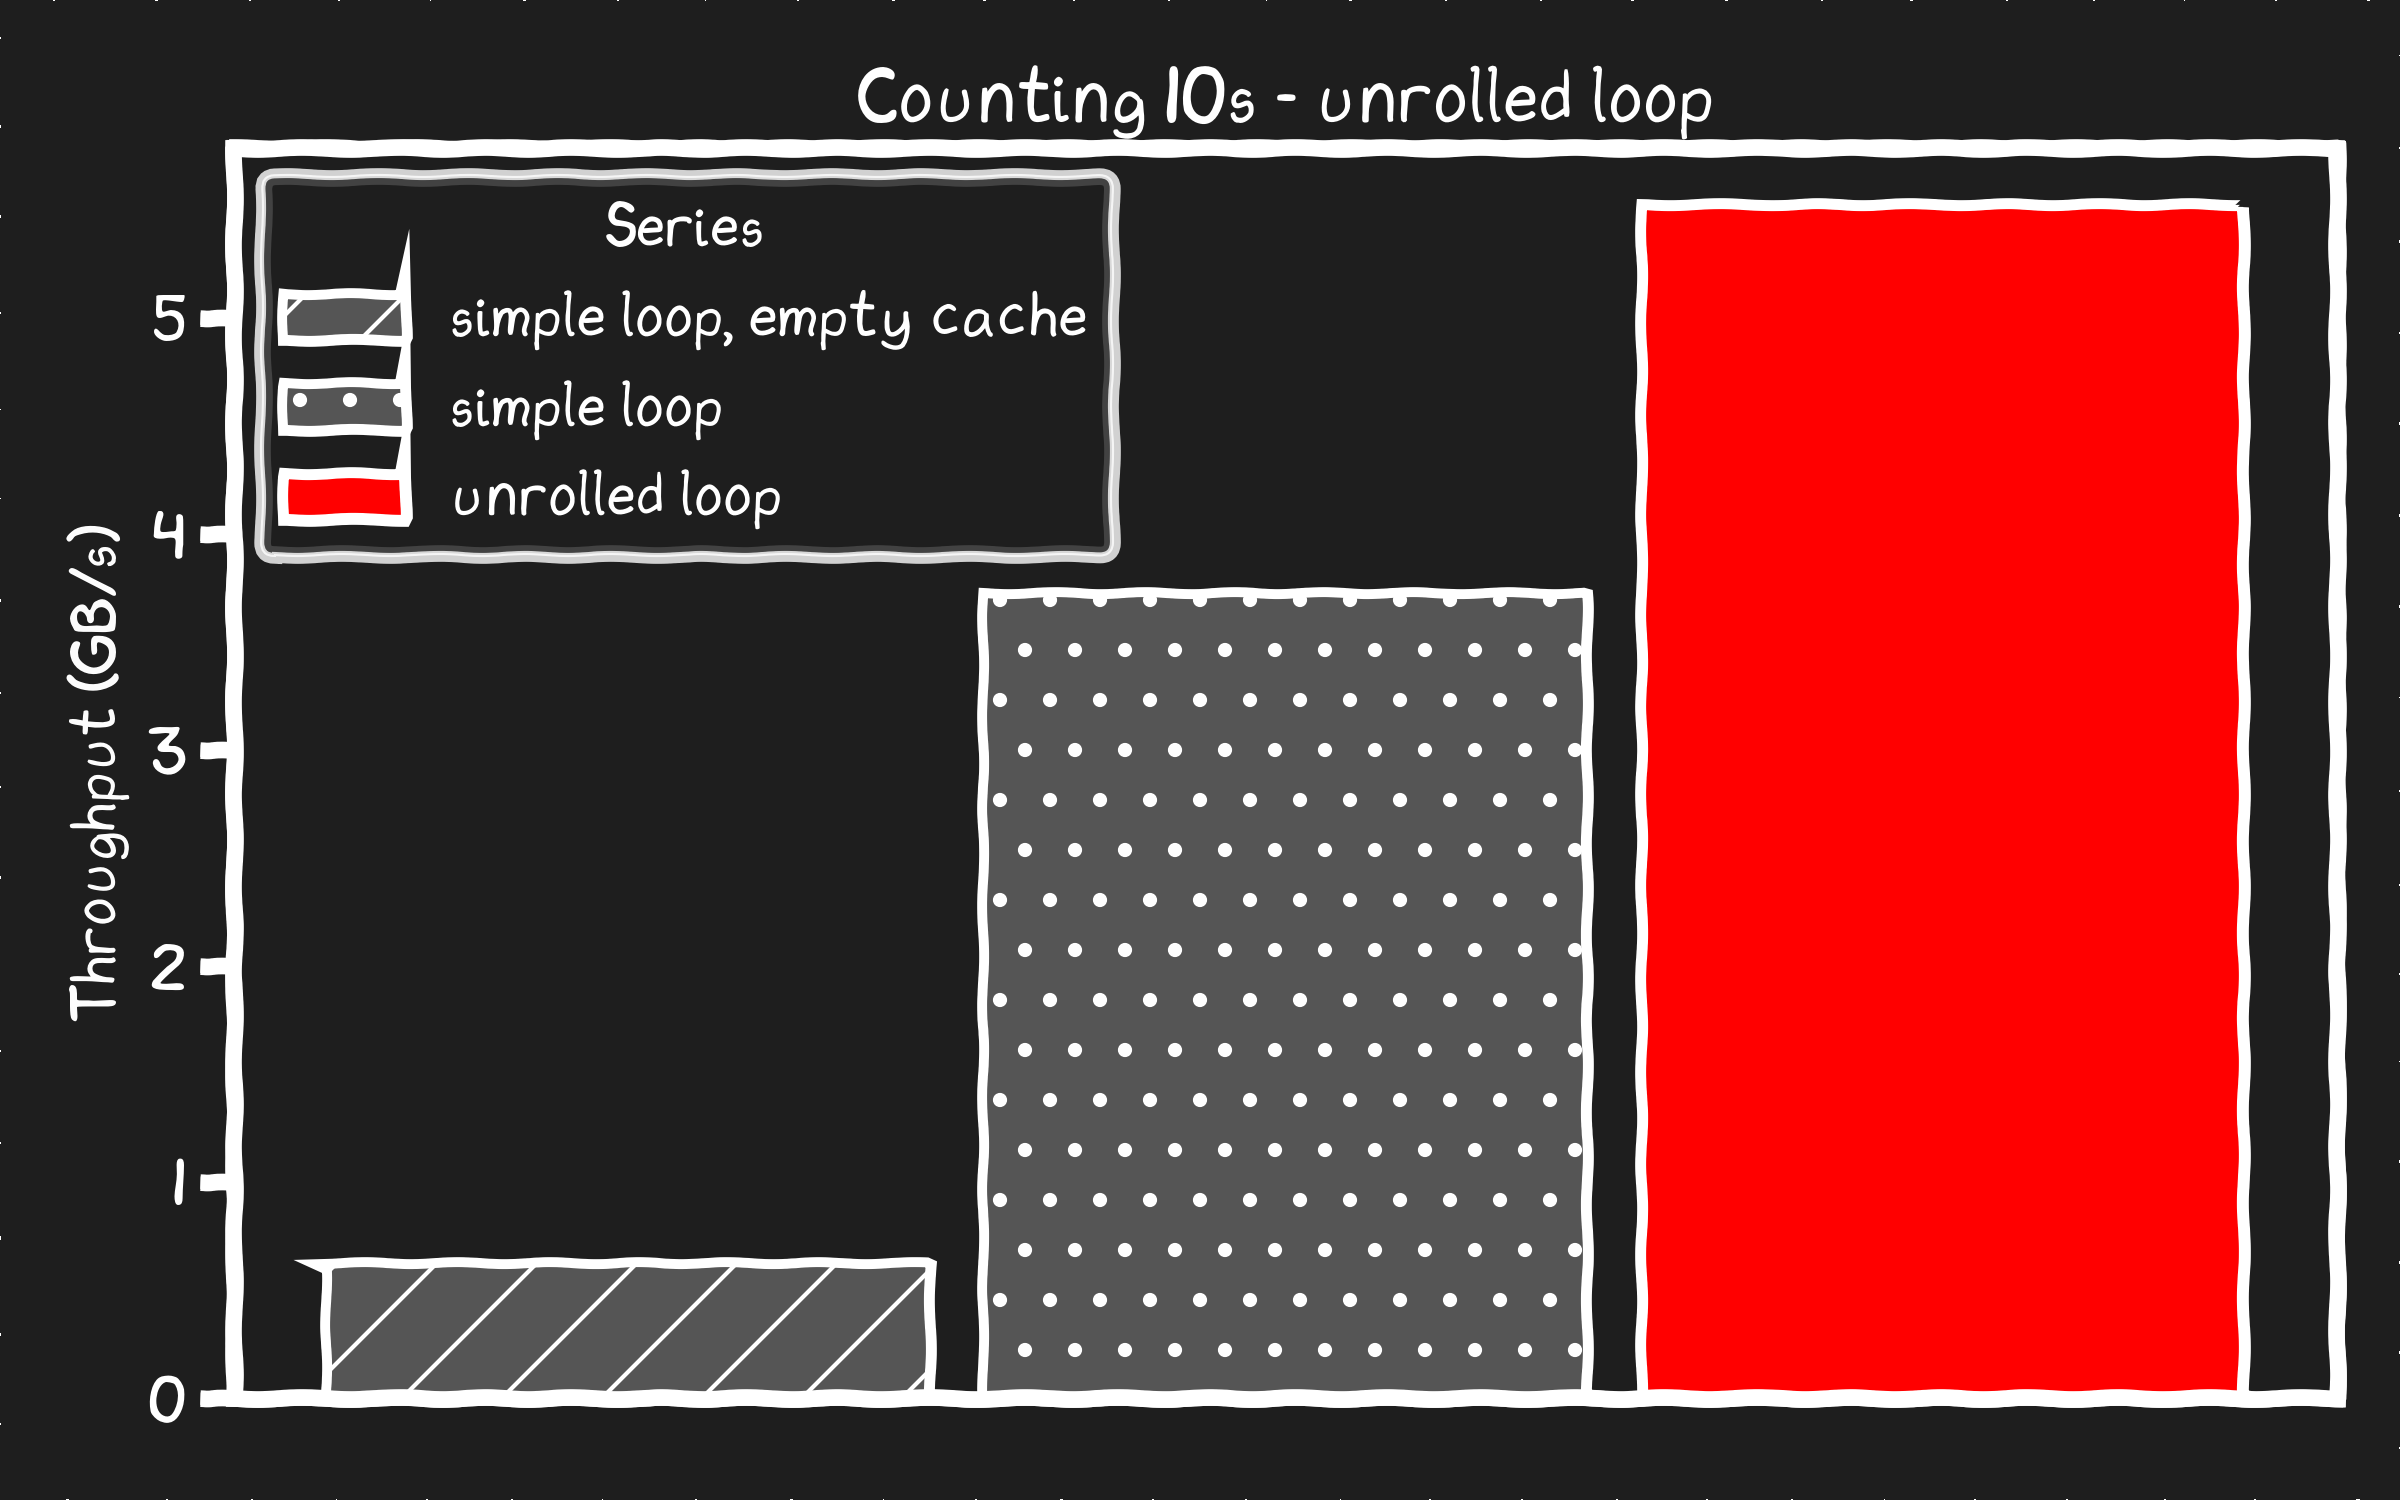
We're still nowhere close to hitting the memory bus speed limit of 13GB/s but 50% faster than the original is a win. There must be some other bottleneck.
Can the SSDs beat that?
5.51GB/s? On paper the SSDs can read at 6.2GB/s, but the first run from disk only did 0.61GB/s. How can I meet or beat this performance sourcing the data directly from disk?
Consider how the default mmap() mechanism works, it is a background IO pipeline to transparently fetch the data from disk. When you read the empty buffer from userspace it triggers a fault, the kernel handles the fault by reading the data from the filesystem, which then queues up IO from disk. Unfortunately these legacy mechanisms just aren't set up for serious high performance IO. Note that at 610MB/s it's faster than what a disk SATA can do. On the other hand, it only managed 10% of our disk's potential. Clearly we're going to have to do something else.
SSDs don't just automatically read data at multigigabyte speeds. You need to put some real effort into an IO pipeline to get serious performance.
I made a io_uring based IO engine, a kind of userspace driver, that can hit these speeds. The main thread will request data, the IO engine will handle the IO, then the main thread will do the counting when the data is in a buffer. We will use a set of queues to manage the IO requests, responses, and buffers. The IO engine will start 6 workers, target a queue depth of 8192, and have a buffer size of 16KB.
I wish I had tighter code here, but A) I didn’t have time to clean it up B) some of the complexity is intractable. The IO engine code was a lot to scroll through so I moved it to github link
#include "io_engine.h"
#include <sys/mman.h>
#include <getopt.h>
#include <stdio.h>
#include <stdlib.h>
#include <fcntl.h>
#include <sys/mman.h>
#include <stdint.h>
#include <sys/time.h>

#define DEFAULT_WORKERS 6
#define DEFAULT_BLOCK_SIZE 16384
#define DEFAULT_QUEUE_DEPTH 8192

// Count the number of "10" (int format) in the buffer
static inline size_t count_tens_unrolled(void* data, size_t size_bytes) {
    const size_t total = size_bytes / sizeof(int);
    // Get the compiler to align the buffer
    const int * __restrict p = (const int * __restrict)__builtin_assume_aligned(data, 4096);
    uint64_t c0=0, c1=0, c2=0, c3=0,
            c4=0, c5=0, c6=0, c7=0,
            c8=0, c9=0, c10=0, c11=0,
            c12=0, c13=0, c14=0, c15=0;

    // Unrolling the compiler knows it can use a vector unit like AVX2 to process
    for (size_t i = 0; i < total; i += 16) {
        // removed 'if' to get it to be branchless: each compares to 10, adds 0 or 1
        c0  += (unsigned)(p[i+ 0] == 10);
        c1  += (unsigned)(p[i+ 1] == 10);
        c2  += (unsigned)(p[i+ 2] == 10);
        c3  += (unsigned)(p[i+ 3] == 10);
        c4  += (unsigned)(p[i+ 4] == 10);
        c5  += (unsigned)(p[i+ 5] == 10);
        c6  += (unsigned)(p[i+ 6] == 10);
        c7  += (unsigned)(p[i+ 7] == 10);
        c8  += (unsigned)(p[i+ 8] == 10);
        c9  += (unsigned)(p[i+ 9] == 10);
        c10 += (unsigned)(p[i+10] == 10);
        c11 += (unsigned)(p[i+11] == 10);
        c12 += (unsigned)(p[i+12] == 10);
        c13 += (unsigned)(p[i+13] == 10);
        c14 += (unsigned)(p[i+14] == 10);
        c15 += (unsigned)(p[i+15] == 10);
    }

    // pairwise reduce to help some compilers schedule better
    uint64_t s0 = c0 + c1,   s1 = c2 + c3,   s2 = c4 + c5,   s3 = c6 + c7;
    uint64_t s4 = c8 + c9,   s5 = c10 + c11, s6 = c12 + c13, s7 = c14 + c15;
    uint64_t t0 = s0 + s1,   t1 = s2 + s3,   t2 = s4 + s5,   t3 = s6 + s7;

    return (t0 + t1) + (t2 + t3);
}

int main(int argc, char *argv[]) {
    char* filename = argv[1];
    size_t size_bytes = strtoull(argv[2], NULL, 10);

    // Set up the io engine
    ioengine_t* na = ioengine_alloc(filename, size_bytes, DEFAULT_QUEUE_DEPTH, DEFAULT_BLOCK_SIZE, DEFAULT_WORKERS);

    sleep(1);

    // Use the background workers to read file directly
    size_t total_blocks = na->file_size / na->block_size;
    uint64_t uid = 1;
    size_t count = 0;

    long start = get_time_us();

    // Read all blocks
    size_t blocks_queued = 0;
    size_t blocks_read = 0;
    int buffer_queued = 0;
    while (blocks_read < total_blocks) {
        //// Queue IO phase //////
        //     Do we have more blocks to queue up?
        if (buffer_queued < na->num_io_buffers/2 && blocks_queued <= total_blocks) {
            // Calculate how many blocks on average we want our workers to queue up
            size_t free_buffers = (size_t)(na->num_io_buffers - buffer_queued - 4); // hold back a few buffers
            size_t blocks_remaining = total_blocks - blocks_queued;  // how many blocks have we not queued
            size_t blocks_to_queue = free_buffers > blocks_remaining ? blocks_remaining : free_buffers;
            int blocks_to_queue_per_worker = (int) (blocks_to_queue + na->num_workers - 1) / na->num_workers;
            // Iterate through workers and assign work
            for (int i = 0; i < na->num_workers; i++) {
                worker_thread_data_t* worker = &na->workers[i];
                // Try to queue N blocks to this worker
                for (int j = 0; j < blocks_to_queue_per_worker; j++) {
                    if (blocks_queued == total_blocks) break;
                    int bgio_tail = worker->bgio_tail;
                    int bgio_head = worker->bgio_head;
                    int bgio_next = (bgio_tail + 1) % worker->num_max_bgio;
                    int next_bhead = (worker->buffer_head + 1) % worker->num_max_bgio;
                    if (bgio_next == bgio_head) break;  // queue for send requests is full
                    if (next_bhead == worker->buffer_tail) break; // queue for recieving completed IO is full
                    // Queue this block with the worker.  We have to track which buffer it's going to.
                    int buffer_idx = worker->buffer_start_idx + worker->buffer_head;
                    na->buffer_state[buffer_idx] = BUFFER_PREFETCHING;
                    worker->bgio_uids[bgio_tail] = (uid++)<<16; // unique id helps track IOs in io_uring, we encode 4 bytes later
                    worker->bgio_buffer_idx[bgio_tail] = buffer_idx;
                    worker->bgio_block_idx[bgio_tail] = blocks_queued++;  // block sized index into file
                    worker->bgio_queued[bgio_tail] = -1;  // Requested but not yet queued
                    int next_tail = (bgio_tail + 1) % worker->num_max_bgio;
                    worker->bgio_tail = next_tail;
                    // Log the buffer in an ordered queue for us to read
                    worker->complete_ring[worker->buffer_head] = buffer_idx;
                    worker->buffer_head = next_bhead;
                    buffer_queued++;
                }
                // Tell the worker to submit IOs as a group
                worker->bgio_submit++;
            }
        }

        //// Completion Phase //////
        //     Iterate through worker and check if they have complete IOs
        for (int i = 0; i < na->num_workers; i++) {
            worker_thread_data_t* worker = &na->workers[i];
            int current = worker->buffer_tail;
            // We know what IO's we're waiting on, but we have to poll
            //  to see if they are done.
            for (int scan = 0; scan < worker->num_max_bgio; scan++) {
                // Scan until we get to the end of the list
                if (current == worker->buffer_head) break;
                int buffer_idx = worker->complete_ring[current];
                int state = na->buffer_state[buffer_idx];
                if (state == BUFFER_PREFETCHED) {
                    // This buffer is completed - Process this buffer.
                    count += count_tens_unrolled(na->io_buffers[buffer_idx], na->block_size);
                    na->buffer_state[buffer_idx] = BUFFER_UNUSED;
                    blocks_read++;
                    buffer_queued--;
                }
                current = (current + 1) % worker->num_max_bgio;
            }
            // IO's might have been completed out of order, advance the tail when we can
            current = worker->buffer_tail;
            while (current != worker->buffer_head) {
                int buffer_idx = worker->complete_ring[current];
                int state = na->buffer_state[buffer_idx];
                if (state != BUFFER_UNUSED) break;
                current = (current + 1) % worker->num_max_bgio;
            }
            worker->buffer_tail = current;
            worker->bgio_submit++;  // probably unnecessary
        }
    }
    long elapsed = get_time_us() - start;
    printf("diskbased found %ld 10s processed at %0.2f GB/s\n", count, (double)(size_bytes/1073741824)/((double)elapsed/1.0e6));

    // Cleanup I/O system
    ioengine_free(na);

    return 0;
}
I hope all this extra code makes it faster.
❯ sudo ./diskbased/benchmark ./mnt/datafile.bin 53687091200
diskbased found 167802249 10s processed at 5.81 GB/s
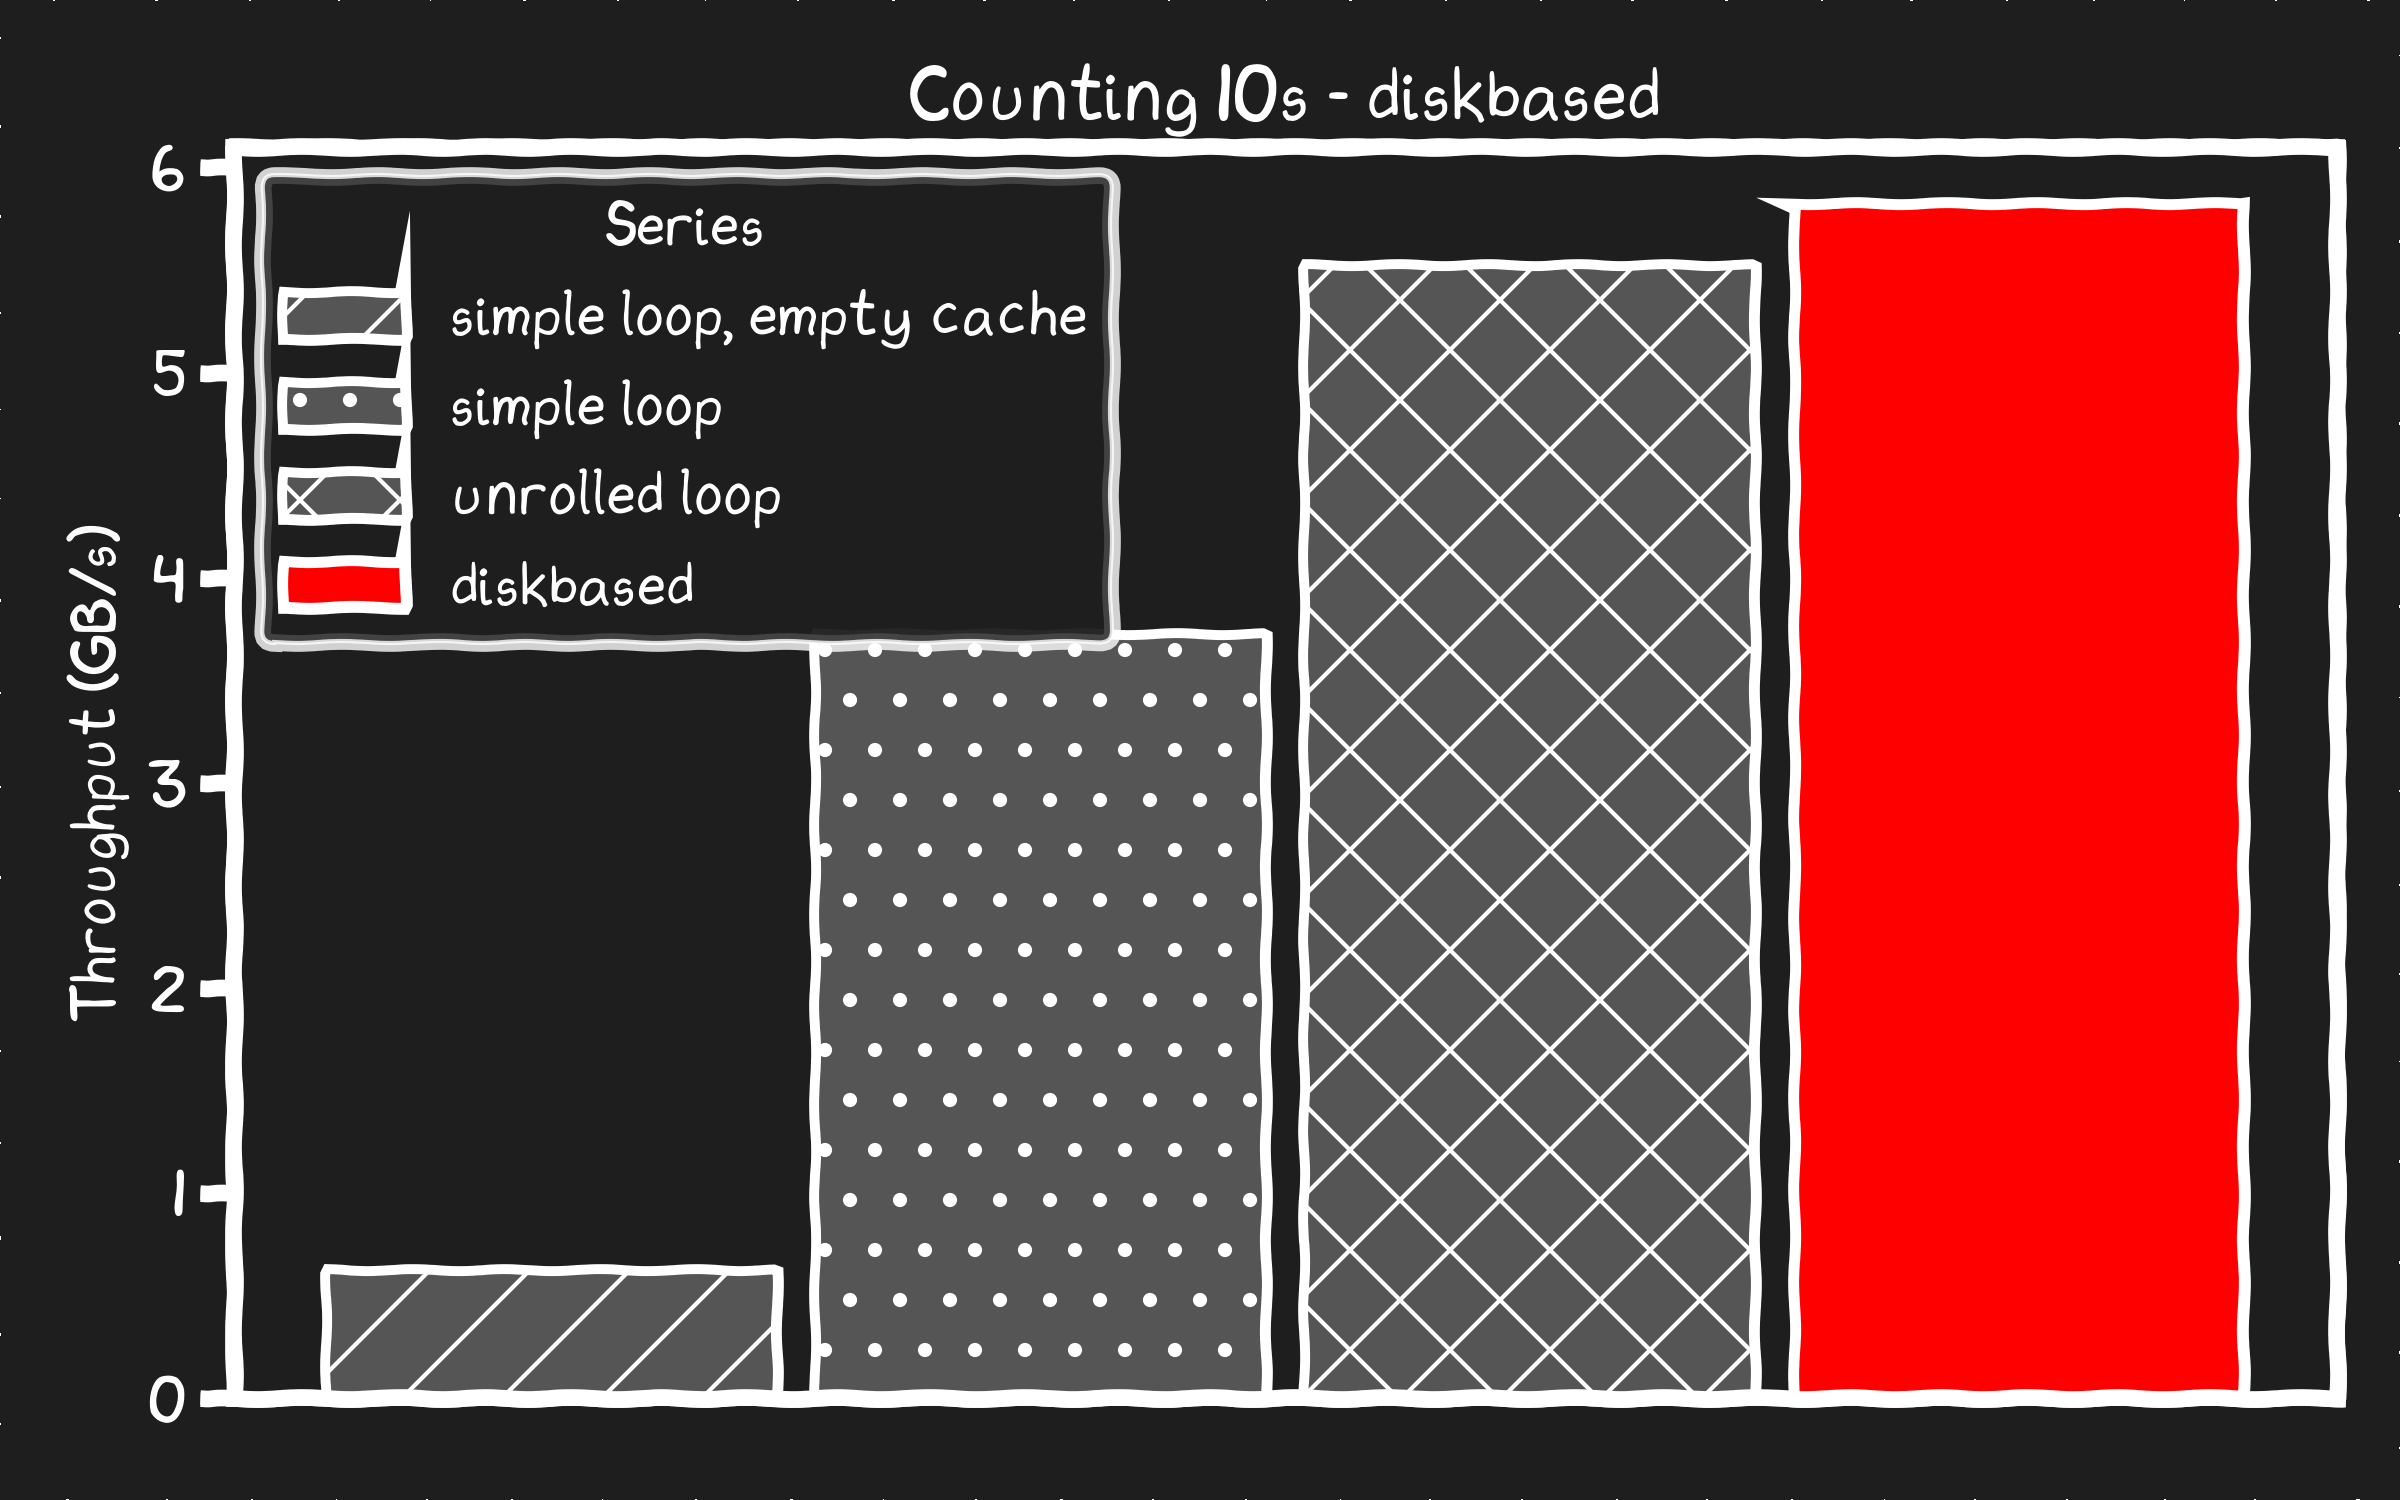
Boom! Disk is faster than memory! It takes several hundred lines of code but now we can source the data from my SSDs faster than the copy from the page cache in memory.
So what's going on here?
Of course my 6GB/s disk stripe isn’t actually faster than the memory bus, even on this weird hack of a system. So what is happening? Where is the bottleneck? It's got to be the way the data is being read from the page cache in memory.
What if we replace the mmap() with a read() from disk into a preallocated buffer. That way we can measure the counting with the data in-memory without any page cache related overhead mmap() can introduce.
#include <stdio.h>
#include <stdlib.h>
#include <sys/time.h>
#include <sys/stat.h>
#include <fcntl.h>
#include <unistd.h>
#include <stdint.h>
#include <string.h>

long get_time_us() {
    struct timeval tv;
    gettimeofday(&tv, NULL);
    return tv.tv_sec * 1000000L + tv.tv_usec;
}

int main(int argc, char *argv[]) {
    char* filename = argv[1];
    size_t size_bytes = strtoull(argv[2], NULL, 10);
    size_t total_ints = size_bytes / sizeof(int);
    size_t count = 0;

    int fd = open(filename, O_RDONLY|O_DIRECT);
    void *buf;
    posix_memalign(&buf, 4096, size_bytes);
    int *data = buf;

    size_t off = 0;
    while (off < size_bytes) {
        ssize_t n = read(fd, (char*)data + off, size_bytes - off);
        off += (size_t)n;   // YOLO: assume n > 0 until done
    }

    long start = get_time_us();
    for (size_t i = 0; i < total_ints; ++i) {
        if (data[i] == 10) count++;
    }
    long elapsed = get_time_us() - start;

    printf("simple loop %ld 10s processed at %0.2f GB/s\n",
           count,
           (double)(size_bytes/1073741824)/((double)elapsed/1.0e6));


    // Get the compiler to align the buffer
    const int * __restrict p = (const int * __restrict)__builtin_assume_aligned((void*)data, 4096);
    uint64_t c0=0, c1=0, c2=0, c3=0,
            c4=0, c5=0, c6=0, c7=0,
            c8=0, c9=0, c10=0, c11=0,
            c12=0, c13=0, c14=0, c15=0;

    start = get_time_us();
    // Unrolling the compiler knows it can use a vector unit like AVX2 to process
    for (size_t i = 0; i < total_ints; i += 16) {
        // removed 'if' to get it to be branchless: each compares to 10, adds 0 or 1
        c0  += (unsigned)(p[i+ 0] == 10);
        c1  += (unsigned)(p[i+ 1] == 10);
        c2  += (unsigned)(p[i+ 2] == 10);
        c3  += (unsigned)(p[i+ 3] == 10);
        c4  += (unsigned)(p[i+ 4] == 10);
        c5  += (unsigned)(p[i+ 5] == 10);
        c6  += (unsigned)(p[i+ 6] == 10);
        c7  += (unsigned)(p[i+ 7] == 10);
        c8  += (unsigned)(p[i+ 8] == 10);
        c9  += (unsigned)(p[i+ 9] == 10);
        c10 += (unsigned)(p[i+10] == 10);
        c11 += (unsigned)(p[i+11] == 10);
        c12 += (unsigned)(p[i+12] == 10);
        c13 += (unsigned)(p[i+13] == 10);
        c14 += (unsigned)(p[i+14] == 10);
        c15 += (unsigned)(p[i+15] == 10);
    }

    // pairwise reduce to help some compilers schedule better
    uint64_t s0 = c0 + c1,   s1 = c2 + c3,   s2 = c4 + c5,   s3 = c6 + c7;
    uint64_t s4 = c8 + c9,   s5 = c10 + c11, s6 = c12 + c13, s7 = c14 + c15;
    uint64_t t0 = s0 + s1,   t1 = s2 + s3,   t2 = s4 + s5,   t3 = s6 + s7;

    count = (t0 + t1) + (t2 + t3);
    elapsed = get_time_us() - start;

    printf("unrolled loop %ld 10s processed at %0.2f GB/s\n",
           count,
           (double)(size_bytes/1073741824)/((double)elapsed/1.0e6));
}
If we keep the dataset smaller than a numa domain and we bind this to a single numa node to prevent numa overheads we see that the theoretical memory bandwidth we projected seems to be the primary bottleneck for the unrolled loop as we hoped to see at the outset.
❯  sudo numactl --cpunodebind=0   ./in_ram mnt/datafile.bin 2147483648
simple loop 6709835 10s processed at 4.76 GB/s
unrolled loop 6709835 10s processed at 13.04 GB/s
But this isn't useful to compare the with the other runs with the 50GB dataset. However if we do the full 50GB dataset the performance suffers. We have to get much of the data across numa domains which is going to be higher cost.
❯ sudo ./in_ram ./mnt/datafile.bin 53687091200
simple loop 167802249 10s processed at 3.76 GB/s
unrolled loop 167802249 10s processed at 7.90 GB/s
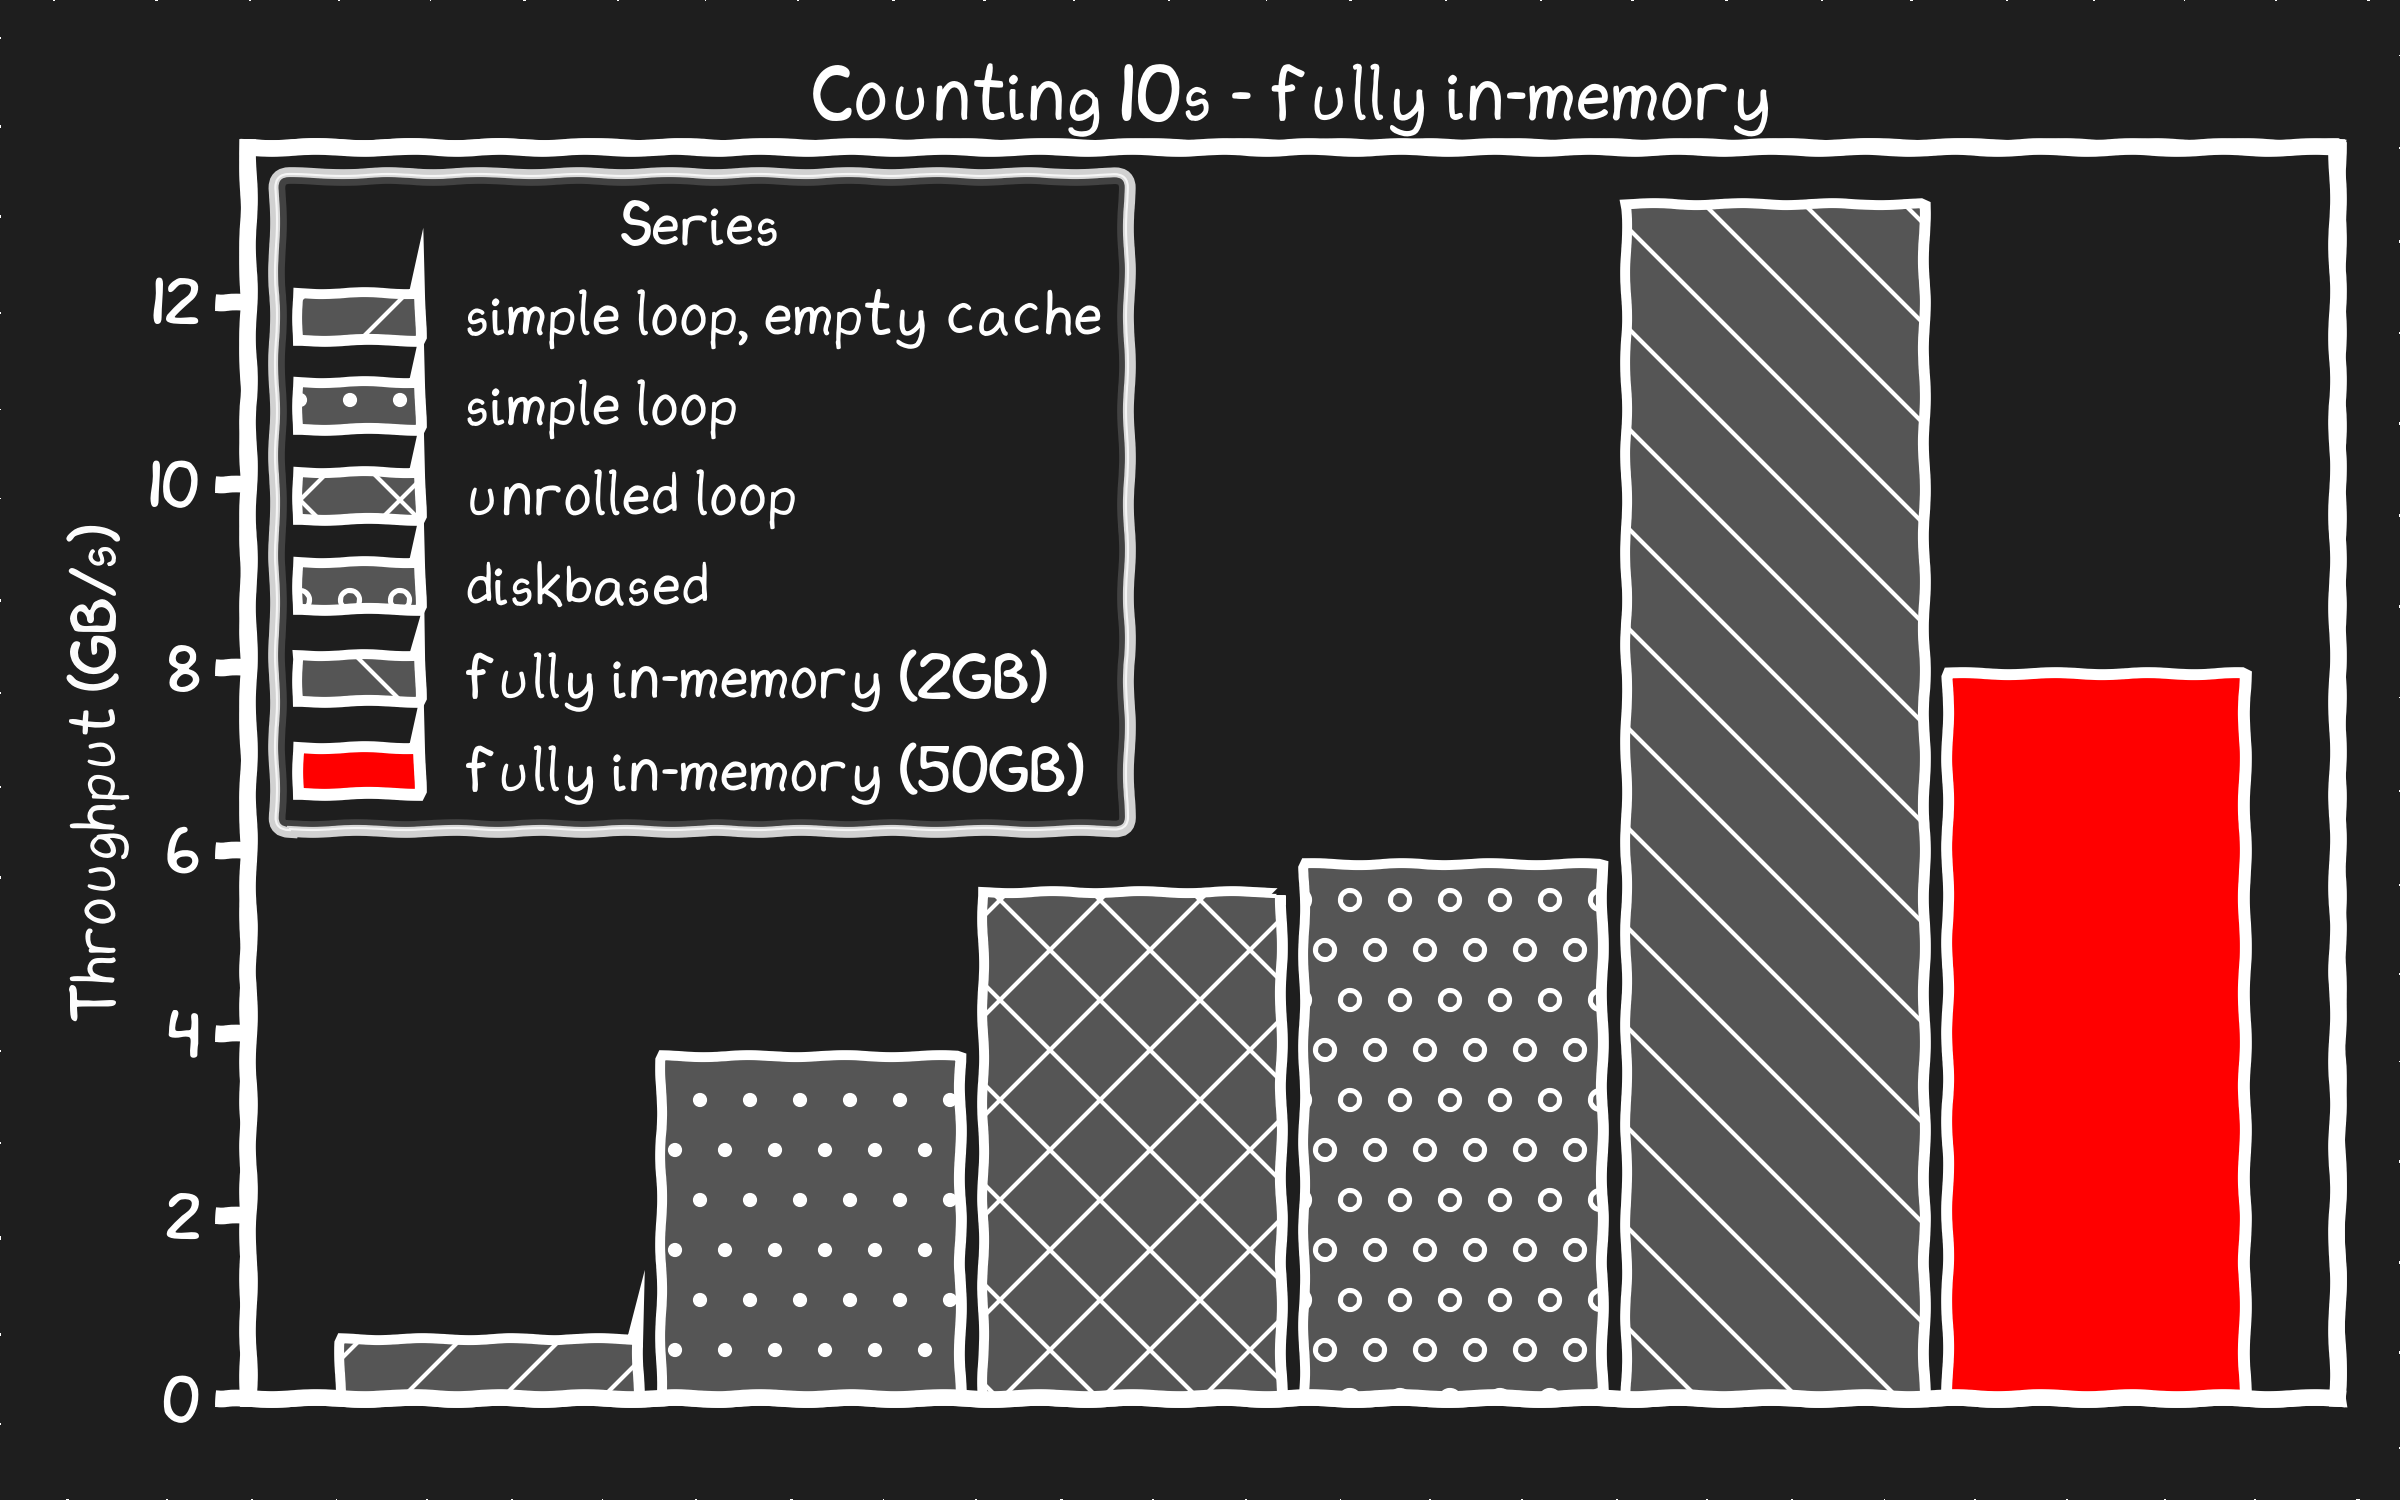
Comparing the results of "fully in-memory (50GB)" which is pre-loaded in memory before measuring against the "unrolled loop" that is only cached in memory we see 40% overhead. That's 2.75 seconds out of 9 seconds that was spent waiting on the caching system instead of counting. Why so much?
mmap()
The mmap() call presents the process with a buffer that is a blank slate even when the data is already in memory. The buffer is populated page by page as it's accessed from the page cache. This isn't a copy, it's just the operating system mapping the cached memory into the process. This costs more than it might seem. The worst case with mmap() the counting has to pause at every 4KB page boundary while the kernel processes a fault, tracks down the page of data in the page cache, then updates the page table of the process to insert the memory into the process. Fundamentally this is a process that is limited by the memory latency, not the CPU speed or memory bandwidth. With the potential for TLB walks and searching lists that track the page cache, we’re taking potentially dozens of CPU cache misses and several microseconds of waiting on memory for every 4KB page.
direct IO
Using our direct from disk approach uses pipelines and streams which avoids the kind of memory latency dominated bottleneck that mmap() has. In our case we're limited by the bandwidth of our disks yet because of the pipelining, the larger latency of the IOs doesn't get in the critical path of the counting very much. Allowing for higher throughput.
Scaling
Consider the implications of these experiments as we scale. The well vetted solution to get data from memory to a process is slower than using the disk directly. This isn't because the memory is slower than the disk. The memory has higher bandwidth than the disk, not by an order of magnitude, but a decent margin. But the latency of the memory is orders of magnitude lower than the disk. Nevertheless the way the data in memory is accessed is the culprit. Its a synchronous approach that assumes memory operations are cheap and low latency. These accesses add up and it ends up waiting on memory latencies. The disk method on the other hand is as a streaming approach built to leverage bandwidth and hide latencies.
extending the existing rig
If I got a few more of these disks I could push the IO bandwidth to be greater than the 13GB/s per thread memory bandwidth limit. IO is DMA'ed to buffers that are pretty small compared to the total dataset. These buffers scale with the throughput capabilities of the CPU and the disks, not the dataset size. The buffers can be located in a single numa domain allowing us to avoid the overhead of accessing the buffers between NUMA domains. Add more disks to this system I might be able to create a disk based solution to count at the full 13GB/s rather than be limited to the 7.90GB/s we see with the in memory example at the full 50GB dataset. With such a system our throughput would not be affected by the dataset size, unlike the in-memory case, which has numa overhead and eventually runs out of memory to scale.
faster than memory is possible
On a proper modern server the CPUs will let you do IO directly to the L3 cache, bypassing memory altogether. Because PCIe bandwidth is higher than memory bandwidth, on paper we could even get more max bandwidth than we can get from memory if we carefully pin the buffers into the CPU cache. I haven't confirm this works in practice, however, it could be made to work and is the sort of thing that CPU designs will be forced to lean into to push performance forward.
memory is changing too
This isn't just about disks vs memory. Similar techniques and principles apply to memory. Memory bandwidth is still scaling even if the latency is not. This means to take advantage of memory performance you have to actually treat it more like a disk and less like Random Access Memory. To scale performance with generational updates you have to make sure to stream data from memory into the CPU caches in blocks, similar to how data is streamed from disk to memory. If not you end up with 90s level memory throughput. A custom mechanism to cache data in memory could easily avoid the memory latency problems seen with the default mmap() solution with much less code than the io_uring solution.
Is this worth it?
I'm not going to say that going to the effort of implementing something like this is always worth it. The mmap() method is sure elegant from a coding perspective, especially when compared to all the code I had to write to get the io_uring setup working. Sometimes the simple way is the way to go.
Is using 6 cores of IO for 1 core of compute is always the right answer? Probably not. This was an extreme situation to prove a point. In realworld situations you'll need to look at the tradeoffs and decide what's best for your use case. Correctly understanding the strengths and weaknesses of the hardware can open up a number of possibilities where you can get a lot more performance for a lot less money.
The kind of overhead demonstrated with mmap() isn’t going to go away, new hardware isn't going to fix it. At the same time disk bandwidth and the number of cores are scaling each generation. But doing things that scale performance with new technology is going to take extra code and effort.
But don't just blow this stuff off. Sure you can dedicate a server with 3TB of memory to serve 10K client connections. Memory in the cloud is like ~$5/GB/month, if you can afford it, then you do you. However it is worth considering that humanity doesn't have the silicon fabs or the power plants to support this for every moron vibe coder out there making an app. I figure either the karmic debt to the planet, or a vengeful AI demigod hungry for silicon and electricity will come for those that don't heed this warning, eventually. Either way my conscience is clear.
Recap
- Memory is slow - when you use it oldschool.
- Disk is fast - when you are clever with it.
- Test the dogma - compounded exponentials are flipping somethings from true to false.
Bad news is that this cleverness requires extra code and effort.
Good news is we now have AI to write and test the extra code this cleverness requires.
Better news is that, for those that are willing to learn, AI's don't do this unless you know how to ask them.
Lean into things that scale, avoid things that don’t.
Next Time
What will be revealed in the next episode?
- Is O(√n) actually faster than O(log n)? Will the foundations of Computer Science survive this unveiling?
- Will traditional code be consumed into the latent space of our AI overlords?
- Is AI hiding these performance gains from me? Is AI even capable of writing optimized code?
Jared Hulbert
A few notes for the "um actually" haters commenting on Hacker News:
- This is not and does not claim to be an academic paper.
- I do not intend to prove that NAND is a drop in replacement for DRAM.
- Tis but a humble and hopefully fun exercise in exploring the limits and trends of modern hardware and the tradeoffs needed to maximize performance.
- As I stated before I have no problem with your choice to ignore this and write lazy code that will perform just as fast on new hardware in 15 years as it does on todays hardware. In fact I applaud your choice. Jeff Bezos has an orbital yacht to build, someone has to pay for it, why not you?
- I am not an AI. I am a human with a computer that don't write perfect.
source code can be found here.